Why the 4% Rule Fails When Markets Fall First
Jermaine Carter · · 11 min read
Retirement income planning has a math problem that most people don't see until it's too late. The 4% rule — the idea that you can withdraw 4% of your portfolio annually and not run out of money over 30 years — is not wrong in theory. The problem is that theory assumes you get to pick the order of your returns. You don't. And the order turns out to matter more than the average.
Morningstar's December 2025 State of Retirement Income report placed the base-case safe starting withdrawal rate at 3.9% for a new retiree planning a 30-year horizon with a 90% probability of success. That's a useful data point. But what it doesn't tell you is what happens when the worst years show up first — and what a fixed monthly withdrawal does to a portfolio that's already falling.
The 2000–2002 Timeline: A Study in Sequence Risk
Consider a retiree who arrives at January 1, 2000 with a substantial portfolio invested entirely in stocks, planning to withdraw a large share of the starting balance annually — well above what conventional guidance recommends. They are following the conventional template: stay invested in equities for growth, draw a fixed amount each month, and let compounding work over time.

The order in which returns arrive determines whether compounding works for or against a retiree.
What they ran into instead was the dot-com collapse. The S&P 500 posted annual total returns of -9.10% in 2000, -11.89% in 2001, and -22.10% in 2002 — three consecutive losing years, the only such streak since the Great Depression. The index didn't just fall. It fell while this retiree was selling shares every month to fund living expenses.
When a portfolio loses value and you continue taking withdrawals, you're forced to sell a larger percentage of your remaining assets each time. Those sold shares can't participate in any future recovery. By the time the market returned 28.68% in 2003, the retiree's portfolio had shrunk so dramatically that the recovery lifted a much smaller dollar amount. The math was compounding against them, not for them.
Morningstar's research found that retirees who experienced poor returns in the first five years and did not adjust their spending were far more likely to exhaust their portfolios. The term for this is sequence-of-returns risk, and it is the single biggest structural threat to any retirement income plan built around a fixed withdrawal from a fully invested portfolio.
Arithmetic Averages vs. What You Actually Compound
Part of why this surprises people is that the return numbers quoted in financial marketing don't describe reality with precision. The average stock market return is about 10% annually over long horizons — but that figure is an arithmetic mean. What an investor actually compounds at is the geometric return, and those two numbers are not the same when returns vary.
The arithmetic average is calculated by adding up annual returns and dividing by the number of years. The geometric mean — sometimes called the compound annual growth rate — accounts for the effect of losses on a shrinking base. As S&P 500 historical data shows, the arithmetic average of yearly returns has historically been around 12%, but the actual compound annual growth rate from 1928 through 2025 is 10.0%. In a volatile sequence, the arithmetic average will always be higher than the geometric return — the gap is often called "volatility drag."
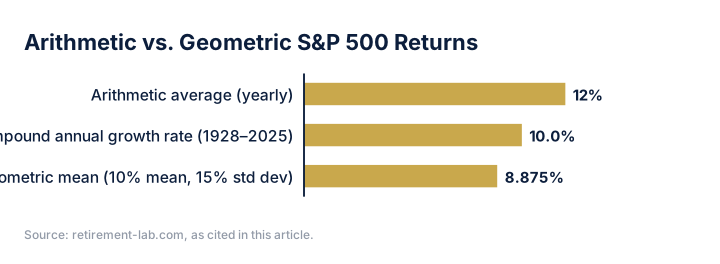
The gap between the arithmetic average and the actual compound rate shows how volatility drag reduces what investors truly earn over time.
For a portfolio with an arithmetic mean return of 10% and a standard deviation of 15%, the variance drain is approximately 1.125%, pulling the geometric mean down to roughly 8.875%. Over a 30-year retirement, the gap between what the arithmetic average implies and what the geometric average delivers can be hundreds of thousands of dollars. When you layer fixed withdrawals on top of a volatile portfolio, the drag compounds faster — because you're reducing the base that recoveries have to work with.
The 2000s illustrated this starkly. The decade's arithmetic return for the S&P 500 was not deeply negative — the index had strong years mixed with catastrophic ones. But the geometric return for the entire decade from January 2000 through December 2009 was negative. Two major crashes sandwiching a mid-decade recovery created enough volatility to erase a decade's compounding entirely.
The Conservative Spending Paradox
The conventional response to sequence risk is to adopt a very low withdrawal rate and hold a portfolio heavy in stocks and bonds, then simply take the same dollar amount every month regardless of market conditions. The logic is that a low rate provides enough buffer for bad years.

Withdrawing a fixed amount from a falling portfolio accelerates the depletion of assets that cannot recover.
The problem with this approach, taken in isolation, is that it conflates withdrawal rate with withdrawal strategy. A retiree who began drawing a fixed monthly income from an all-equity portfolio at the market peak in early 2000 quickly found themselves selling shares at deeply depressed prices in the years that followed — far more shares than the original withdrawal math had assumed. The rate looks conservative on paper. The behavior in the real sequence was not conservative at all.
Consider what the numbers actually looked like. Take a retiree who started January 2000 with $1,000,000 in an S&P 500 index fund and withdrew $40,000 at the start of each year — a 4.0% initial withdrawal rate, well within conventional guidance. The index posted total returns of -9.10% in 2000, -11.89% in 2001, and -22.10% in 2002. The combined effect wasn't just the market's loss. The portfolio ended 2002 at approximately $541,969 — down 45.8% — even though the index itself fell 37.4% over those three years. The gap between those two figures is the entire problem: the extra 8.4 percentage points came directly from selling shares on the way down. Those shares were gone before the recovery began.
The implied withdrawal rate tells the same story in a different way. That $40,000 annual draw represented 5.0% of the remaining portfolio by the end of 2000, 7.0% by the end of 2002, and 9.6% by 2003 — not because the retiree changed their behavior, but because the denominator kept shrinking. A fixed dollar withdrawal becomes an escalating percentage draw on a falling portfolio, almost automatically. And from a base of roughly $541,969, the portfolio needed an 84.5% gain just to return to its starting point — while still paying out $40,000 a year.
Kiplinger's analysis of Morningstar data described a similar scenario: a new retiree with a $1 million all-stock portfolio at the end of 1999, taking $40,000 annual withdrawals with 2% inflation adjustments, who would have seen the account lose nearly half of its value in the 2000–02 bear market — and then faced the market's 28.4% gain in 2003 from that reduced base. At elevated withdrawal rates, the damage compounds faster. Selling shares on the way down means the recovery in 2003 landed on a much smaller pile.
The insight here is structural. A retiree with no pension, no guaranteed income base, and all of their spending coming from a volatile portfolio faces a problem that a low withdrawal rate alone does not solve. The sequence of returns in the early years of retirement can permanently impair the portfolio's ability to sustain income — even if the long-term average returns eventually look reasonable.
Sequence-of-returns risk is not a market timing problem. It is an income architecture problem — and solving it requires building a structure that doesn't depend on the market being cooperative in the first years of retirement.
What a Better Architecture Looks Like
Research on alternative withdrawal strategies has evolved meaningfully. Morningstar's 2025 State of Retirement Income report found that more flexible spending approaches — ones that adjust withdrawals in response to portfolio performance — can support starting withdrawal rates up to 5.7% from a 40% stock, 60% bond portfolio, compared to 3.9% under a fixed-dollar approach. The flexibility itself is the mechanism: it prevents the portfolio from being forced to sell at maximally destructive times.

Building a retirement income floor changes how much pressure a volatile portfolio must absorb during down markets.
Beyond flexible withdrawals, the structure of a retirement income plan matters as much as the withdrawal rate. When a portion of spending needs are covered by guaranteed or more predictable income sources — Social Security claiming strategy, a pension, or an annuity that provides a floor — the portfolio doesn't have to do as much heavy lifting during down markets. That means fewer shares sold at depressed prices, more of the base preserved for recovery, and a meaningfully different long-term outcome.
For retirees with no pension, this floor-building process becomes especially important. It's the difference between a plan where every withdrawal requires selling assets regardless of market conditions, and a plan where the worst-case market scenario triggers a temporary reduction in discretionary spending rather than a permanent reduction in the portfolio's recovery potential.
The 4% rule was never designed to be a comprehensive income strategy — it was developed as a stress-test benchmark using historical data back to 1926. Applied as a full plan, it leaves the retiree fully exposed to the sequence of whatever the next decade delivers. Applied as one input within a coordinated income architecture, it becomes a useful reference point rather than a constraint.
If you're within five years of retirement and your spending plan still assumes a fixed monthly draw from a fully invested portfolio, the 2000–2002 timeline is worth reviewing carefully. Our team works through these tradeoffs regularly — including how Social Security timing, income layering, and spending flexibility interact to change the picture. We're happy to talk through what that looks like in practice.
Common Questions
What is sequence-of-returns risk in retirement?
Sequence-of-returns risk is the danger that poor market returns in the early years of retirement can permanently impair a portfolio's ability to sustain income, even if long-term average returns are acceptable. When you withdraw a fixed dollar amount from a falling portfolio, you're forced to sell more shares at depressed prices. Those shares cannot participate in the subsequent recovery, which shrinks the base that future gains can work with.
Why does the 4% rule not account for sequence risk?
The 4% rule was developed as a historical stress test, not a real-time income strategy. It identifies a withdrawal rate that survived the worst historical sequences — but it assumes a fixed dollar withdrawal regardless of market conditions. In practice, withdrawing the same amount in year two of a bear market as in year one means selling more depreciated shares, accelerating the portfolio's decline. Morningstar's December 2025 research placed the current baseline safe withdrawal rate at 3.9% for a 30-year horizon at 90% probability — but even that figure assumes a disciplined, often flexible spending approach.
What is the difference between arithmetic and geometric returns, and why does it matter for retirement?
The arithmetic average return adds up annual returns and divides by the number of years. The geometric return — or compound annual growth rate — accounts for compounding and the effect of losses on a shrinking base. These two numbers diverge when returns are volatile: historically, the S&P 500's arithmetic average has been higher than its 10.0% compound annual growth rate from 1928 through 2025. For retirees making ongoing withdrawals, what matters is the geometric return — the actual compounding they experience — not the arithmetic average that often appears in headline performance figures.
Sources
- Morningstar's December 2025 State of Retirement Income report placed the safe starting withdrawal rate at 3.9% for a 30-year horizon at 90% probability of success.
- S&P 500 annual total returns: -9.10% in 2000, -11.89% in 2001, -22.10% in 2002, and +28.68% in 2003.
- Morningstar's 2025 research found retirees who experienced poor returns in the first five years and did not adjust spending were far more likely to exhaust their portfolios.
- The S&P 500's compound annual growth rate from 1928 through 2025 is 10.0%, while the arithmetic average of yearly returns is around 12%.
- For a portfolio with an arithmetic mean of 10% and a standard deviation of 15%, the variance drain is approximately 1.125%, pulling the geometric mean to roughly 8.875%.
- A new retiree with a $1 million all-stock portfolio at end of 1999, taking $40,000 annual withdrawals with 2% inflation adjustments, would have seen the account lose nearly half its value in the 2000–02 bear market, and faced the market's 28.4% gain in 2003 from that reduced base.
- Morningstar's 2025 State of Retirement Income report found flexible spending approaches can support starting withdrawal rates up to 5.7%.
- 4% rule defined as safe annual withdrawal over a 30-year retirement
- dividend.school
- thorft.com